Stocks zipped higher in the past week, capping the first four-day rally since early 2009. Get out the party hats and confetti, right? Bears tried to knock shares lower on Tuesday and early Thursday, but after they failed bids hit the tape in a big way and gave it lift.
Technically, stocks continued to move out of the invalidated head-and-shoulders pattern we've discussed lately. With support below at 1,040, the S&P 500 Index should be good for a run to resistance at the 1,095 to 1,115 area in coming days as long as earnings reports and corporate outlooks are supportive.
But the bulls have their work cut out for them there.
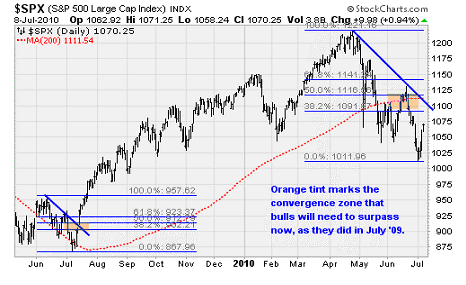
That area marks a significant congestion zone given the large amount of price discovery that's taken place there in the past nine months: It marks the October high, the November-December trading range, the January-February reversals, and the May-June reversal. It also marks resistance from the 200-day moving average and the 50% Fibonacci retracement of the recent decline.
Sorry my chart is so dense, but I wanted to get all of these levels on there. Note that the big jump higher back in July last year in this very week had to shoulder past similar congestion. The blue diagonal line on the right represents the downtrend that has to be surpassed if bulls are going to wriggle out of the tight spot they are in; again, this was similar to the downtrend they busted through a year ago, which is that blue diagonal line on the left.
A move to 1,115 would be worth another 4%. If stocks can move over that level and hold it for a week, the next stop would be the January high at 1,150 and beyond that, April's high at 1,220. I doubt they can muster that kind of energy, but you never say never in this business.
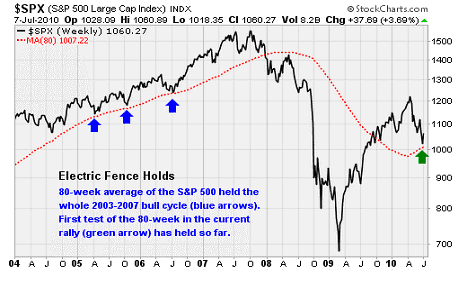
Keep in mind that a lot of trend-followers exited the market when it fell under the 200-day average, so any move back over that level would require those guys to jump back in. They will be very reluctant to do so but then would be forced in, creating a fantastic squeeze. Not saying that will happen, but it's just something to put in your back pocket as a possibility. A lot of major "structural" moves occur that have nothing to do with corporate fundamentals and everything to do with the fact that the market tends to dart around in ways that cause the greatest pain to the majority. Knowing and accepting this fact can save you a lot of confusion.
This is a good spot to stress the difference between my short-term optimism and my long-term caution. Considering the invalidation of the bearish head-and-shoulders pattern on Wednesday, as well as the deeply oversold condition, it's reasonable to expect higher prices in the next few weeks no matter how earnings come in. This is just a trading call; markets never go straight up or down.
|

But over the longer term, the inability of U.S. companies to gain enough traction to create jobs; the fragile state of the housing market; huge developed-nation sovereign debt burdens; and fiscal tightening are big headwinds. Governments and central banks do have the power to counter these traumas for awhile with new tax incentives, bond purchases, and money printing, but they are very mistake prone, and that is where the challenge lies. If leaders make a series of policy mistakes, earnings growth will falter, bond defaults will expand, and investors will sensibly withdraw from equities in droves.
HISTORY SPEAKS
Those of you who have read my latest book know I'm a big history guy. And it's days like Wednesday that really make me interested in hitting the data and understanding where that kind of big rise fits into the long-term picture.
Here's the deal: Wednesday's impressive action -- a 3% up move in the S&P 500 -- was relatively rare. In fact, aside from the recent volatility in May and June, the last time stocks posted one-day gains of this magnitude was during the climb out of the March 2009 bear market low.
My research team went back and looked at the S&P 500 going back to 1938 when situations were similar to the present. The takeaway: History suggests stocks are headed higher over the next 6 to 12 months.
When the S&P 500 has posted a one-day gain of more than 3% at a time that stocks were below both their 200-day and 50-day moving averages, the average return over the next six months was 6.5%. The average return over the next 12 months was 15%. Both measures were statistically significant at the 99% confidence level.
Here's another filter: Whenthe stock market was in bull mode and the economy was expanding, the instances of 3%+ up days during spans when stocks were below their 50-day and 200-day moving averages marked excellent buying opportunities. There were a few times during bear markets when the 3%+ up day signal was all wrong -- such as March and September 2008, the 2000-2001 period, 1973, 1946, and 1940 -- but during bull markets, this is a signal worth listening to.
Another filter: The signal can be made stronger by adding in a data point to reflect the condition of the economy. Recently, we've talked about the strength of the 12-month change in the Leading Economic Index -- which is based on things like hours worked and interest rates -- as a predictor of economic growth. Looking only at the years in which the 12-month LEI was positive (as it is now), one can reduce the number of false positives given by the 3%+ signal.
With the LEI filter, the 12-month forward return increased to 16.8%. And although the sample size was smaller (there have been 20 occurrences since 1962), the results were still statistically valid at the 99% confidence level. There were still a few bad calls during bearish conditions in October 2000 and early 2002. But overall, the results were very positive.
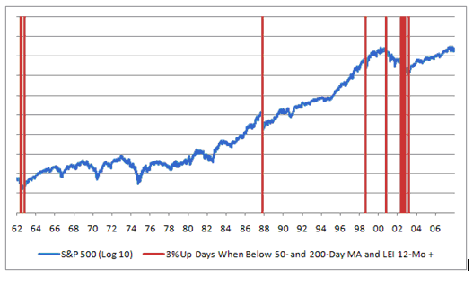
In the chart above, I have illustrated these 3%+, sub 50-day and 200-day signals along with the S&P 500. I took the 10-base log of the price to reduce the visual height and fit it all in the chart. And I've only included the signals that occurred when the LEI 12-month growth rate was positive. The picture tells us that is the time to be optimistic about the stock market -- as it was in 1962, 1987, 1998, and 2003.
I found this data surprising, but that's why we test these kinds of ideas: To challenge the conventional wisdom, and see how investors have acted in the past when presented with similar stimuli.
If this rebound does work out, my guess is that it will occur because the U.S. Federal Reserve, Congress and executive branch have figured out new ways to incentivize positive investor behavior.
Don't be surprised if the Obama administration suddenly announces that it will not turn back the clock on capital gains and dividend taxes, or even decides to push Congress to extend Bush-era tax cuts. That would be worth at minimum a summer rally back to the 200-day average in the 1,090 to 1,100 area of the S&P 500. After that, if we get there, it will be up to the quality of the earnings that companies report later this month; investors' reaction to executives' second-half outlook; and the efficiency with which European leaders pursue their fiscal austerity plans.
FAIRY TALES AND VOLATILITY
The news flow in the past week was unusually positive. The International Monetary Fund (IMF) increased its global economic growth forecast for the year by 0.4% to 4.6%. Retailers reported solid same store sales for June. And initial weekly jobless claims fell more than expected, a rare positive data point on the jobs front.
Over in Europe, the Bank of England and the European Central Bank (ECB) kept interest rates on hold. German industrial output for May was stronger than the consensus expected while German exports surged 9.2% -- a sign that a devalued euro is raising export competitiveness.
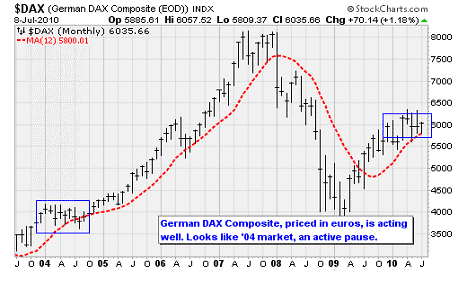
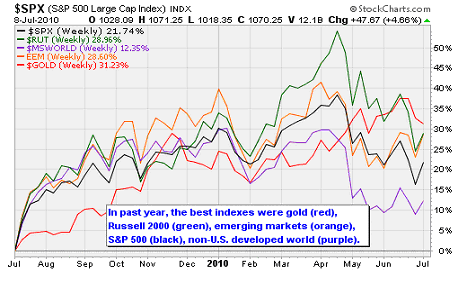
There is talk in Germany of a "fairytale" summer of optimism as an economic rebound combines with the country's solid performance in the 2010 FIFA World Cup (although they lost Wednesday). The mood is similar to that of 2006, which was featured in a popular documentary ''Deutschland. Ein Sommermarchen,'' translated as A Summer Fairy Tale. In the chart above, you can see that the German stock market, priced in its native currency, is performing quite well -- still above its 12-month average, unlike the U.S. benchmark indexes.
Volume on Wall Street was a bit lower than average, which is typical of the summer season. But breadth was positive, with advancing issues outpacing decliners by 3.4 to 1 margin. New highs outpaced new lows 77 to 16. Up volume accounted for 81% of total volume -- which wasn't as strong as Wednesday's big 95% up volume day but is robust nonetheless.
Remember that it's typical for the market to pause for breath after a big 90%+ up volume day. The fact that it didn't, and the lack of conviction by the bears, suggests this is more than just a short-term, dead-cat, short-covering bounce. When combined with our historical analysis from Wednesday, we could very well be looking at the initiation of a strong medium term uptrend that sees stocks moving higher into August.
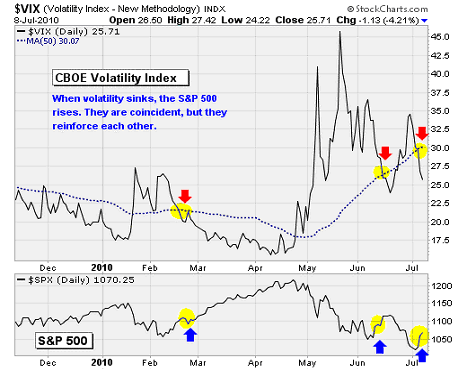
One of the data points supporting our short-term thesis is the way that risk aversion -- represented by the CBOE Volatility Index -- has melted away like ice cream in the summer sun over the past few days. Just check out the chart above. The VIX has made a pattern of lower highs since May and just moved back below its 50-day moving average.
As you now from previous coverage, stocks tend to do well when the VIX is below 30. Indeed, the VIX's collapse beneath the 50-day average in late February is what really got the springtime rally into the April high into high gear. The mid-June head fake was a false signal, but many other indicators suggest the market has more oomph behind it this time around.
The VIX and the S&P 500 tend to move opposite each other in a coincident way, so it's not like volatility is predictive. But volatility does tend to trend, so as long as VIX remains under its 50-day average the benchmark U.S. index has a chance to move higher with less jumpiness.
EARNINGS PREVIEW
Today (Monday) marks the start of the second quarter earnings season when Alcoa Inc. (NYSE: AA) reports results after the bell. Analysts expect the company to generate earnings per share of 12 cents compared to a loss of 26 cents over the same period last year. But what about the stock market as a whole?
Overall, 69% of the companies in the S&P 500 report earnings over the next month. This group also represents 75% of the index's total market capitalization. Currently, analysts expect quarterly earnings of $19.50 per share -- which represents a 26% increase over the previous year.
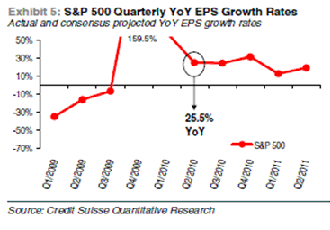
Enjoy theses big growth rates, because they won't last: After this quarter the year-over-year comparisons become more difficult as we are no longer comparing to the recessionary quarters of 2008 and 2009 but are looking at quarters in which the economy sprang back to life. In the chart above from Credit Suisse, you can see how the consensus earnings growth estimate tails off heading into 2011.
For the full year, analysts expect 2010 earnings to reach $81.60 per share. This is just 3.1% below 2007 peak earnings. Given the current vulnerability of the economy, this may be a bit too optimistic. Tune in next week for a blow by blow account of the first set of earnings reports, and what to expect next.
Week In Review
Monday: Markets closed.
Tuesday: The ISM Non-Manufacturing Index came in under expectations, meaning the services sector expanded at a slower rate in June. The index was 53.8, down from 55.4 previously and under the 55 consensus estimate.
Wednesday: In another sign of weakened demand for housing, the Mortgage Bankers' Association's home purchase mortgage application index fell another 2% last week -- bringing the total May to June decline in the index to 15%.
Thursday: Initial weekly jobless claims fell more than expected -- a rare positive data point on the jobs front. Initial claims fell to 454k for the week, down from 472k previously and the consensus estimate of 465k.
Friday: Wholesale trade data showed that the inventory restocking phase of the economic recovery continues. Despite the trouble in Europe and the stock market slide, wholesalers increased inventories in May by 0.5% over April's 0.2% rise and March's 0.7% increase. May's gains were focused on capital goods like machinery, computers, and electrical goods -- signs of rising business investment.
The Week Ahead
Monday: Aluminum giant Alcoa Inc. (NYSE: AA) kicks Q2 earnings season off after the bell. Analysts expect the company to report earnings of 12 cents per share, up from the loss of 26 cents a year ago. Railroad operator CSX Corp. (NYSE: CSX) will also report.
Tuesday: The latest international trade data will give a read on the trade balance -- an important component of gross domestic product (GDP) growth. Intel (Nasdaq: INTC) reports after the close. Analysts expect earnings of 43 cents per share up from 18 cents per share last year.
Wednesday: Retail sales and business inventories will be reported.
Thursday: A read on inflation from the Producer Price Index, an update on factory output from the Industrial Production reports, and the initial weekly jobless claims report. JPMorgan Chase & Co. (NYSE: JPM) will report earnings before the bell. Analysts expect the bank to report earnings of 72 cents per share -- up from 28 cents a year ago. Google Inc. (Nasdaq: GOOG) will report after the close. Analysts are looking for earnings of $6.54 per share, up from $5.36 last year.
Friday: The Consumer Price Index will be reported along with the latest Consumer Sentiment figures. General Electric Co. (NYSE: GE), Bank of America Corp. (NYSE: BAC) and Citigroup (NYSE: C) will report results before the open. GE is expected to post earnings growth, while BAC and C are expected to post smalle.
HISTORY SPEAKS
Those of you who have read my latest book know I'm a big history guy. And it's days like Wednesday that really make me interested in hitting the data and understanding where that kind of big rise fits into the long-term picture.
Here's the deal: Wednesday's impressive action -- a 3% up move in the S&P 500 -- was relatively rare. In fact, aside from the recent volatility in May and June, the last time stocks posted one-day gains of this magnitude was during the climb out of the March 2009 bear market low.
My research team went back and looked at the S&P 500 going back to 1938 when situations were similar to the present. The takeaway: History suggests stocks are headed higher over the next 6 to 12 months.
When the S&P 500 has posted a one-day gain of more than 3% at a time that stocks were below both their 200-day and 50-day moving averages, the average return over the next six months was 6.5%. The average return over the next 12 months was 15%. Both measures were statistically significant at the 99% confidence level.
Here's another filter: Whenthe stock market was in bull mode and the economy was expanding, the instances of 3%+ up days during spans when stocks were below their 50-day and 200-day moving averages marked excellent buying opportunities. There were a few times during bear markets when the 3%+ up day signal was all wrong -- such as March and September 2008, the 2000-2001 period, 1973, 1946, and 1940 -- but during bull markets, this is a signal worth listening to.
Another filter: The signal can be made stronger by adding in a data point to reflect the condition of the economy. Recently, we've talked about the strength of the 12-month change in the Leading Economic Index -- which is based on things like hours worked and interest rates -- as a predictor of economic growth. Looking only at the years in which the 12-month LEI was positive (as it is now), one can reduce the number of false positives given by the 3%+ signal.
With the LEI filter, the 12-month forward return increased to 16.8%. And although the sample size was smaller (there have been 20 occurrences since 1962), the results were still statistically valid at the 99% confidence level. There were still a few bad calls during bearish conditions in October 2000 and early 2002. But overall, the results were very positive.
In the chart above, I have illustrated these 3%+, sub 50-day and 200-day signals along with the S&P 500. I took the 10-base log of the price to reduce the visual height and fit it all in the chart. And I've only included the signals that occurred when the LEI 12-month growth rate was positive. The picture tells us that is the time to be optimistic about the stock market -- as it was in 1962, 1987, 1998, and 2003.
I found this data surprising, but that's why we test these kinds of ideas: To challenge the conventional wisdom, and see how investors have acted in the past when presented with similar stimuli.
If this rebound does work out, my guess is that it will occur because the U.S. Federal Reserve, Congress and executive branch have figured out new ways to incentivize positive investor behavior.
Don't be surprised if the Obama administration suddenly announces that it will not turn back the clock on capital gains and dividend taxes, or even decides to push Congress to extend Bush-era tax cuts. That would be worth at minimum a summer rally back to the 200-day average in the 1,090 to 1,100 area of the S&P 500. After that, if we get there, it will be up to the quality of the earnings that companies report later this month; investors' reaction to executives' second-half outlook; and the efficiency with which European leaders pursue their fiscal austerity plans.
FAIRY TALES AND VOLATILITY
The news flow in the past week was unusually positive. The International Monetary Fund (IMF) increased its global economic growth forecast for the year by 0.4% to 4.6%. Retailers reported solid same store sales for June. And initial weekly jobless claims fell more than expected, a rare positive data point on the jobs front.
Over in Europe, the Bank of England and the European Central Bank (ECB) kept interest rates on hold. German industrial output for May was stronger than the consensus expected while German exports surged 9.2% -- a sign that a devalued euro is raising export competitiveness.
There is talk in Germany of a "fairytale" summer of optimism as an economic rebound combines with the country's solid performance in the 2010 FIFA World Cup (although they lost Wednesday). The mood is similar to that of 2006, which was featured in a popular documentary ''Deutschland. Ein Sommermarchen,'' translated as A Summer Fairy Tale. In the chart above, you can see that the German stock market, priced in its native currency, is performing quite well -- still above its 12-month average, unlike the U.S. benchmark indexes.
Volume on Wall Street was a bit lower than average, which is typical of the summer season. But breadth was positive, with advancing issues outpacing decliners by 3.4 to 1 margin. New highs outpaced new lows 77 to 16. Up volume accounted for 81% of total volume -- which wasn't as strong as Wednesday's big 95% up volume day but is robust nonetheless.
Remember that it's typical for the market to pause for breath after a big 90%+ up volume day. The fact that it didn't, and the lack of conviction by the bears, suggests this is more than just a short-term, dead-cat, short-covering bounce. When combined with our historical analysis from Wednesday, we could very well be looking at the initiation of a strong medium term uptrend that sees stocks moving higher into August.
One of the data points supporting our short-term thesis is the way that risk aversion -- represented by the CBOE Volatility Index -- has melted away like ice cream in the summer sun over the past few days. Just check out the chart above. The VIX has made a pattern of lower highs since May and just moved back below its 50-day moving average.
As you now from previous coverage, stocks tend to do well when the VIX is below 30. Indeed, the VIX's collapse beneath the 50-day average in late February is what really got the springtime rally into the April high into high gear. The mid-June head fake was a false signal, but many other indicators suggest the market has more oomph behind it this time around.
The VIX and the S&P 500 tend to move opposite each other in a coincident way, so it's not like volatility is predictive. But volatility does tend to trend, so as long as VIX remains under its 50-day average the benchmark U.S. index has a chance to move higher with less jumpiness.
EARNINGS PREVIEW
Today (Monday) marks the start of the second quarter earnings season when Alcoa Inc. (NYSE: AA) reports results after the bell. Analysts expect the company to generate earnings per share of 12 cents compared to a loss of 26 cents over the same period last year. But what about the stock market as a whole?
Overall, 69% of the companies in the S&P 500 report earnings over the next month. This group also represents 75% of the index's total market capitalization. Currently, analysts expect quarterly earnings of $19.50 per share -- which represents a 26% increase over the previous year.
Enjoy theses big growth rates, because they won't last: After this quarter the year-over-year comparisons become more difficult as we are no longer comparing to the recessionary quarters of 2008 and 2009 but are looking at quarters in which the economy sprang back to life. In the chart above from Credit Suisse, you can see how the consensus earnings growth estimate tails off heading into 2011.
For the full year, analysts expect 2010 earnings to reach $81.60 per share. This is just 3.1% below 2007 peak earnings. Given the current vulnerability of the economy, this may be a bit too optimistic. Tune in next week for a blow by blow account of the first set of earnings reports, and what to expect next.
Week In Review
Monday: Markets closed.
Tuesday: The ISM Non-Manufacturing Index came in under expectations, meaning the services sector expanded at a slower rate in June. The index was 53.8, down from 55.4 previously and under the 55 consensus estimate.
Wednesday: In another sign of weakened demand for housing, the Mortgage Bankers' Association's home purchase mortgage application index fell another 2% last week -- bringing the total May to June decline in the index to 15%.
Thursday: Initial weekly jobless claims fell more than expected -- a rare positive data point on the jobs front. Initial claims fell to 454k for the week, down from 472k previously and the consensus estimate of 465k.
Friday: Wholesale trade data showed that the inventory restocking phase of the economic recovery continues. Despite the trouble in Europe and the stock market slide, wholesalers increased inventories in May by 0.5% over April's 0.2% rise and March's 0.7% increase. May's gains were focused on capital goods like machinery, computers, and electrical goods -- signs of rising business investment.
The Week Ahead
Monday: Aluminum giant Alcoa Inc. (NYSE: AA) kicks Q2 earnings season off after the bell. Analysts expect the company to report earnings of 12 cents per share, up from the loss of 26 cents a year ago. Railroad operator CSX Corp. (NYSE: CSX) will also report.
Tuesday: The latest international trade data will give a read on the trade balance -- an important component of gross domestic product (GDP) growth. Intel (Nasdaq: INTC) reports after the close. Analysts expect earnings of 43 cents per share up from 18 cents per share last year.
Wednesday: Retail sales and business inventories will be reported.
Thursday: A read on inflation from the Producer Price Index, an update on factory output from the Industrial Production reports, and the initial weekly jobless claims report. JPMorgan Chase & Co. (NYSE: JPM) will report earnings before the bell. Analysts expect the bank to report earnings of 72 cents per share -- up from 28 cents a year ago. Google Inc. (Nasdaq: GOOG) will report after the close. Analysts are looking for earnings of $6.54 per share, up from $5.36 last year.
Friday: The Consumer Price Index will be reported along with the latest Consumer Sentiment figures. General Electric Co. (NYSE: GE), Bank of America Corp. (NYSE: BAC) and Citigroup (NYSE: C) will report results before the open. GE is expected to post earnings growth, while BAC and C are expected to post smalle.
|
Featured Video
 Click here for audio and video featuring your favorite Money Morning contributors. Click here for audio and video featuring your favorite Money Morning contributors. |

0 Responses